How to access your browser's console log
When a bug or error occurs with your ShortStack campaign, Feed, or Comment Import, the support team might ask for a screenshot of your browser's console log.
Overview
A console log is a diagnostic tool built into your web browser that provides a real-time record of events, errors, and messages related to a website's internal operations. Below you will find instructions for each of the most common browsers.
Google Chrome
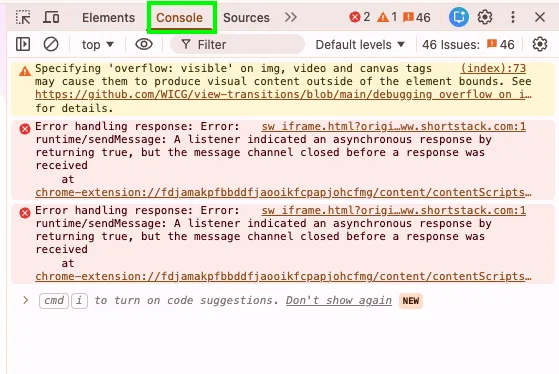
Via settings menu
- Click the three-dot menu (⋮) in the top-right corner.
- Go to More Tools > Developer Tools.
- Select the Console tab.
Via inspect shortcut
- Right-click anywhere on the page and select Inspect.
- Switch to the Console tab at the top of the panel.
Mozilla Firefox
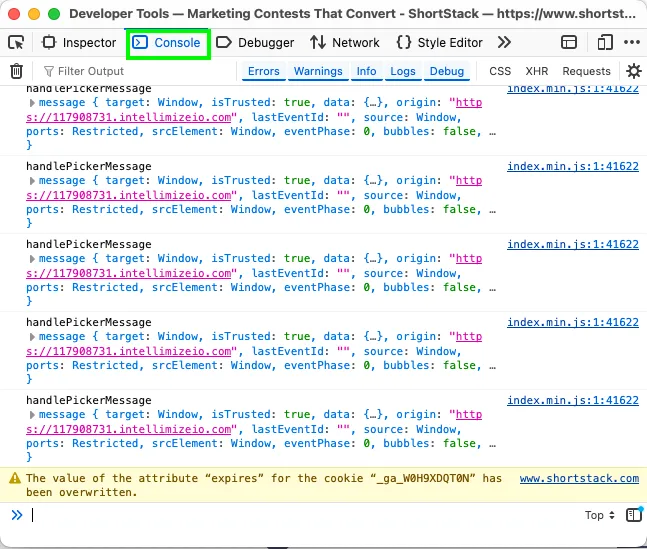
Via settings menu
- Click the hamburger menu (☰).
- Select More Tools > Web Developer Tools, then select the Console tab.
Via inspect shortcut
- Right-click anywhere on the page and select Inspect.
- Click on Console.
Apple Safari
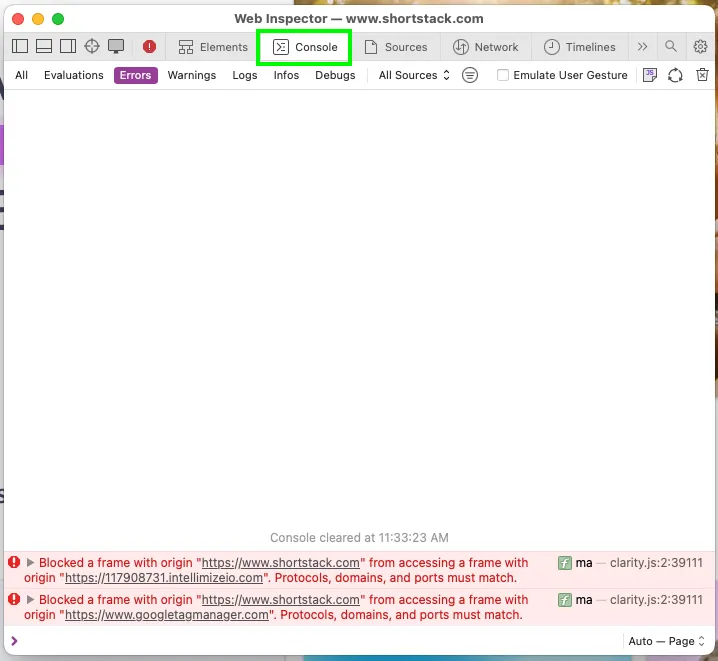
- Go to Safari, then click on Settings (or Preferences).
- Select the Advanced tab.
- Check the box Show features for web developers (or "Show Develop menu in menu bar").
- Once enabled, go to Develop in the top menu bar and select Show JavaScript Console.
Microsoft edge
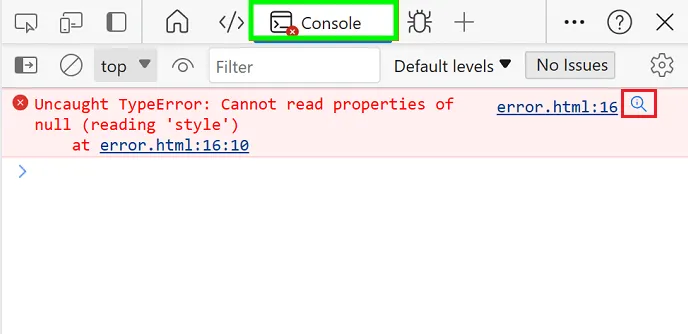
- Click the three-dot menu (⋯).
- Select More Tools > Developer Tools, then click the Console tab.
Keyboard shortcuts
| Browser | Windows/Linux | macOS |
|---|---|---|
| Chrome | Ctrl + Shift + J | Cmd + Option + J |
| Edge | Ctrl + Shift + J or F12 | Cmd + Option + J |
| Firefox | Ctrl + Shift + K | Cmd + Option + K |
| Safari | - | Cmd + Option + C |
Related resources
Troubleshooting Issues with Feeds and Facebook/Instagram Importer Tools
Was this helpful?
Thanks — that helps us decide what to fix next.
Sorry this missed. Tell us what you needed and we'll get you an answer — and fix the page.